icon (3)
Ebook

The TSIA T&S 50 Q4 Index

Download this ebook

By clicking the “Continue” button, you are agreeing to TSIA’s Terms of Use and Privacy Policy.

Download this ebook

Thank you for your interest

Thank you for your interest in: The TSIA T&S 50 Q4 Index

Oops! Something went wrong while submitting the form.

Already have an account?

Sign in
chevron right
September 23, 2026

Overview

Challenges

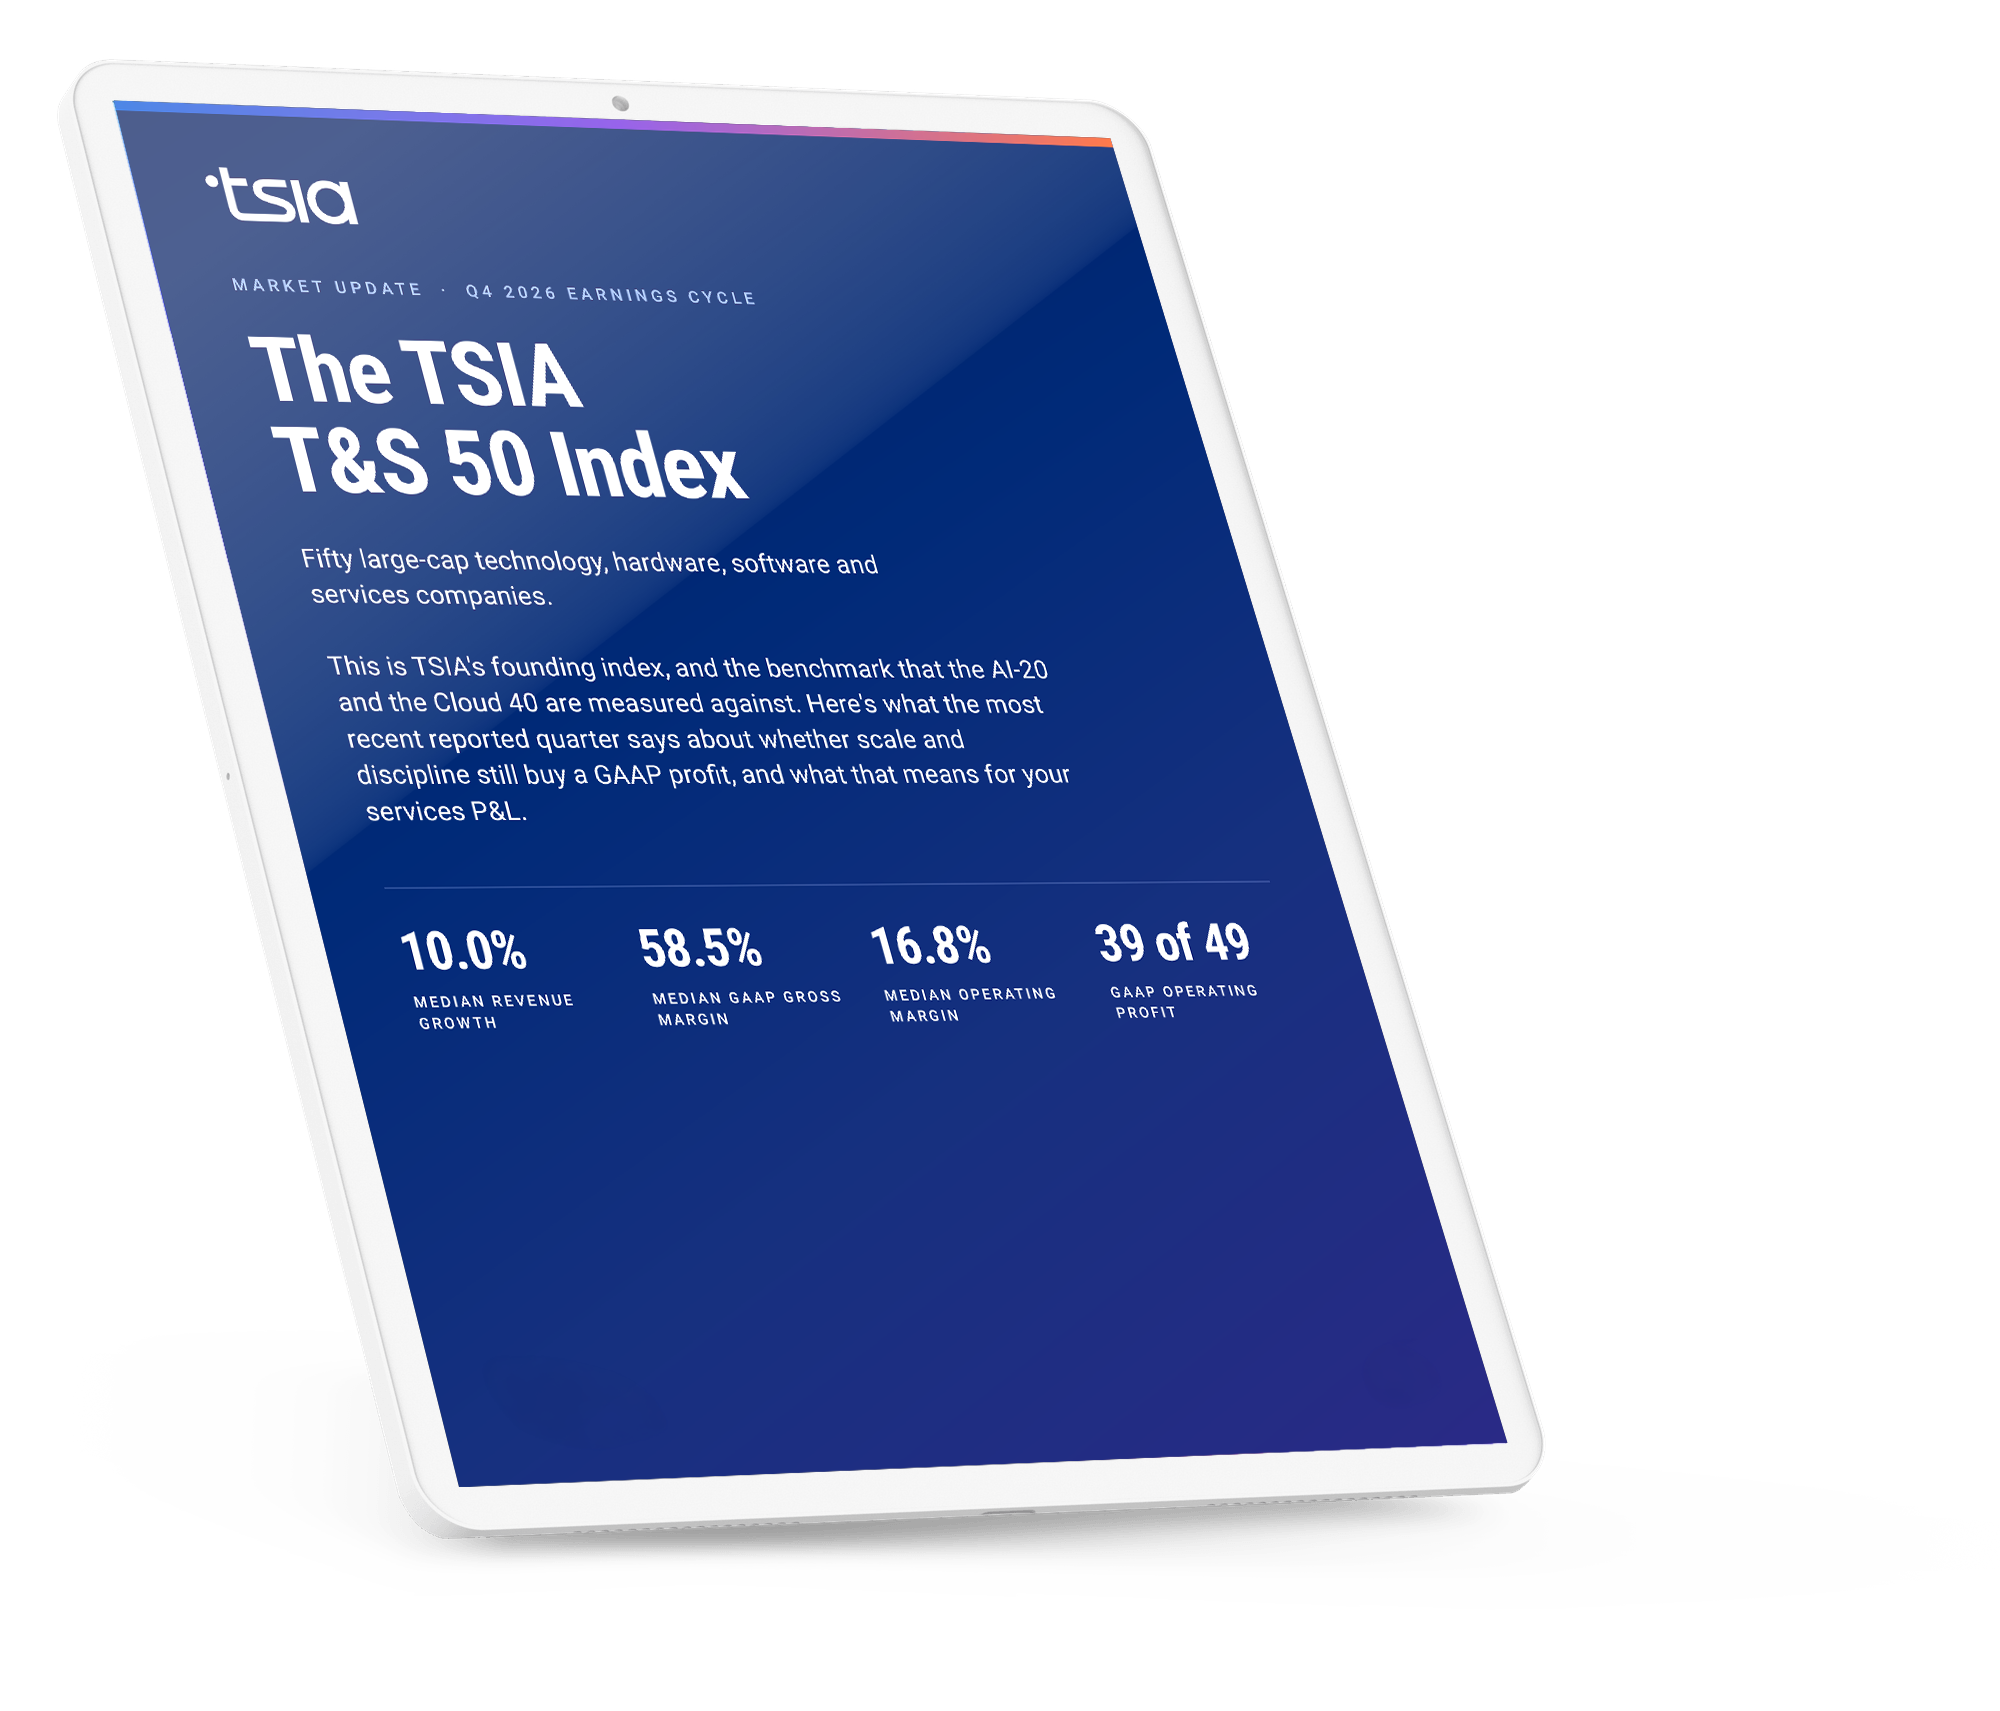
Forty-nine large-cap technology and services companies posted a 16.8% median GAAP operating margin this quarter, and thirty-nine of them are GAAP profitable — on the income statement, this cohort looks healthy. But follow the same companies down to cash, and a different quarter shows up: the most profitable constituents in the index are the ones funding AI infrastructure out of their own balance sheets. If you're approving your AI investment case on operating margin alone, that statement won't show you where the cost actually landed.

Summary

This eBook is TSIA's quarterly GAAP scorecard for the T&S 50 Index — fifty large-cap technology, hardware, software, and services companies, benchmarked using the numbers each one reports to regulators rather than the numbers in a press release. Inside, you'll find why the most profitable companies in the index are also the ones funding AI infrastructure off their own balance sheets, a cohort-by-cohort breakdown of how hardware, software, and services margins actually compare. The operating margin says this cohort is healthy. The cash flow statement says something else.

Key takeaways

The cost of AI shows up in cash flow, not in margin.

Oracle carried a +34.8% GAAP operating margin and negative $5.0B of free cash flow in the same quarter, funding $28.5B of AI-datacenter capex. Microsoft's FY2027 capex guidance sits near $175B, and management has already guided operating margin down for the year ahead. If your AI business case is approved on operating margin alone, you won't see the cost until it's already on your balance sheet.

Growth is real, but it isn't paid for evenly.

Median revenue growth across the index is 10.0%, ranging from +58.0% at Dell Technologies to −21.0% at NCR Voyix. Cohort medians diverge sharply: software grows at 12.8% on a 73.2% gross margin, while services grows at 6.0% on a 34.6% gross margin. Benchmarking a services P&L against the index median, rather than the services cohort, sets a target no delivery organization can hit.

Six IT-services majors took the AI cost in margin. One took it as revenue.

TCS, Wipro, Capgemini, Infosys, Accenture, and HCL Technologies all disclosed margin compression this quarter tied to wage cycles, AI investment, or underutilization. Genpact went the other direction: its agentic-AI line grew 24.1% year over year and now makes up 27% of its revenue mix. The difference is packaging and pricing, not how much AI each company actually built.

Powered by
tsia intelligence logo white

Explore the TSIA Portal

Get instant access to TSIA Intelligence—specialized AI built for tech services—when you create a free TSIA Portal account. Unlock expert research, tailored insights, and data-driven strategies to move your business forward.
Create a free account
Laptop Portal

Trusted by technology services leaders worldwide

image logo adobeimage logo awsimage logo autodeskimage logo bdimage logo bmcimage logo ciscoimage logo cienaimage logo citriximage logo clickupimage logo cognizantimage logo dellimage logo docusignimage logo dropbox
image logo emersonimage logo githubimage logo hpimage logo ibmimage logo lenovoimage logo motorolaimage logo microsoft
image logo mitsubishiimage logo redhatimage logo rockwellimage logo salesforceimage logo schneiderservicenow 842x308image logo siemensimage logo workday
Vector (1)

I find the research TSIA provides are always one step ahead. It certainly helps to see how the industry is changing, and more importantly, what can be done to stay ahead of the game and innovate for our customers.

Vector (2)
Ted Saoumi, Vice President of Technical Support, AVEVA

Get the benefits of membership

Becoming a TSIA member gives you access to an extensive library of leading research and data to fuel your growth. Signing up takes less than a minute—it’s quick, easy, and free.
Create an account
chevron right
Have questions or need guidance?
Connect with a TSIA research expert
chevron right