

TSIA Members conduct benchmarks to understand how their specific organizational performance compares to the industry and their peers. They also benchmark to receive insights and recommendations from TSIA that will improve their overall performance.When practice adoption and/or performance of metrics and results is less than the industry median values, member organizations experience many common challenges. For example, when members have low adoption of key practices coupled with KPIs that are higher than industry median values, the higher KPIs can lull the organization into thinking that their performance is stronger than it actually is. The higher KPIs are often the result of ongoing team heroics which are simply not possible to maintain at scale, and the resulting organization becomes overheated and stressed.As those in the Northern Hemisphere enter the warmer summer months, it seems pertinent to focus this discussion on some of the common characteristics of overheated Support Service organizations and provide key recommendations on how Support organizations can cool down and optimize performance. But first, it will be helpful to provide some background on the Support Services benchmark.TSIA’s Support Services BenchmarkTSIA’s Support Services research practice has the longest-running benchmark, with over 150 questions covering the practices (people, processes, technologies, and organizational models) and performance metrics/results that encompass the following focus areas:
- Support Fundamentals
- Service Financials
- Talent Management
- Customer Satisfaction
- Sales and Marketing
- Assisted Support
- Self Service
- Outsourced Service Management
As a result, our Support Services members benefit from industry and peer data that reflects best practices and pacesetter-level performance reflecting the top 15% of responses across the results and metrics performance measurements. Analyzing such a large segment of benchmark data requires a highly developed data analytics and research team to identify data correlations with practices and metrics/results that result in the highest levels of performance across all nine Support Services benchmarking modules. Having the ability to analyze large volumes of benchmarking data across common performance themes allows each research practice the benefit of using a common practice-specific maturity model.
What is the Support Services Maturity Model?
Since the Support Services maturity model is reliant on analyzing practices vs. results and metrics, it will be helpful to clarify what distinguishes a metric from a result.
- Results: Analytical measurements intended to quantify the state of the business and are the result of implementing specific Support management and operational practices. They are dependent variables, or lagging indicators, for the business.
- Metrics: Analytical measurements that help to quantify the state of those support management practices that have been implemented and are independent variables or leading indicators of the results.
A good example of a result vs. a metric would be resolution and response time. Resolution time is an important desired result that Support helps to achieve for their customers and in this example, resolution time is the lagging indicator. The related metric (or leading indicator) is response time. Response time is the leading-edge time measurement for all incoming assisted support incidents/cases and is included in the time component for total resolution time. Achieving lower response time metrics across all incident priorities helps to achieve lower overall resolution time results, which correlates to higher assisted support CSAT ratings. Aggregating benchmark scoring for practices and results/metrics across all benchmark modules allows TSIA to compare aggregated member benchmark results for all industry and peer group members across two practice and metrics/results axes. The resulting plot is further divided into four categories of Support Services (SS) organizations, as described below, and depicted in Figure 1:
- “Overheated SS”: Characterized by low adoption of key practices and good metric/results, which are likely false positives or can be impossible to maintain at scale.
- “Start-up SS”: Characterized by low adoption of key practices and poor performance on or inability to track standard metrics/results.
- “Maturing SS”: Characterized by good adoption of key practices, but those practices may be too new or too poorly executed to drive better performance.
- “Optimizing/Optimized SS”: Characterized by high adoption of key practices and the ability to drive high attainment of metrics/results; and, for “Optimized SS”, the Support organization can execute most any SS charter at scale.
Figure 1: Support Services Maturity Model
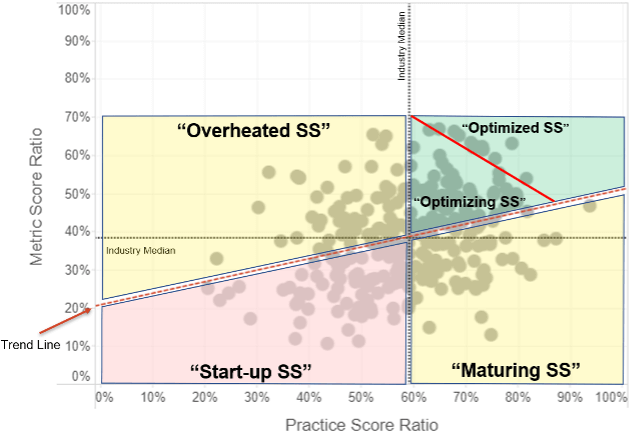
TSIA benchmarking provides its members with the insight and prescriptive advice that allows them to understand Support industry best practices. And when the industry best practices are properly adopted and implemented, Support organizations can better achieve the desired performance levels for those metrics/results that result from adopting each new practice. As each new practice is adopted over time, the resulting performance improves along the same direction as the trend line.
Overheated Support Organization Result and Metric Characteristics
Support organizations that are in the "Overheated SS" quadrant have metrics and results that are above the trend line and for the most part, are above the 39% industry median for metrics/results. And all overheated Support organizations have a practice score ratio that is less than the industry median (59%). Let’s first focus some time on a few of those metrics and results that are helping to fuel the Support team’s sense of being overheated and overworked!A key part of any support operation is keeping a close eye on the channel mix of customer incident submissions into the assisted support process. While we know that email and phone represent two of the highest cost channels that our members support, unless the incoming emails are received and responded to through a robust/automated ticketing process, support engineers will need to manually manage their email incident queues through Outlook, which means customer case information is difficult to find and occasionally misfiled. And since email ticket submission allows your customers free range to describe as much or as little about their specific problem, email often requires more back and forth to and from the assigned support engineer than if the customer had submitted their case using a web form. While our industry will likely never escape using email to support customer case work, perpetuating the use of email by our customers results in additional higher customer and employee effort level, which in turn further fuels the sensation of being overheated and overworked. It is not too surprising that TSIA’s data shows that overheated Support organizations are processing 48% more incoming email volume compared to the industry. As TSIA’s most recent channel preference survey indicates, customers have a high preference for using self-service to resolve questions and technical problems. And yet, overheated Support organizations are receiving 58% less self-service channel demand compared to Industry, as a whole. Factors that result in a lower self-service channel demand are related to the percentage (74%) of overheated Support organizations that are not measuring self-service success; more than 50% less often when compared to the industry. Essentially, most overheated Support organizations are flying blind when it comes to understanding how successful their customers are in utilizing self-service knowledge content to resolve ‘how-to’ and ‘problems with the product’ incident category types.It is natural to wonder how overheated Support organizations are performing in the employee retention category. Interestingly, from an overall employee attrition perspective, overheated organizations experience a 4-point lower overall attrition rate compared to industry. And given my 20+ years of experience in the support industry, I am not overly surprised by this attrition finding, since support employees typically rise to meet occasions when there is an abundance of support volume and escalations. But when the deeper-level attrition categories are further explored, there is one attrition category – involuntary attrition – that sees just under 20% more attrition compared to Industry. Next, we will turn our discussion to the “Practices” maturity model axis.
While All Practices Matter, Some Rise Up Higher Towards the Surface of the Pool
As the name implies, being in the "Overheated SS" quadrant means that Support organizations are working extremely hard to deliver acceptable levels of support and service to their customers. Oftentimes, we see that while the team is delivering overall good results, the cost of achieving acceptable service is being paid for by the employees themselves. So, the first vital practice that overheated Support organizations often fail to implement is the inability to provide support team employees with a voice (like Voice-of-the-Customer satisfaction survey programs) through a formal employee engagement or employee satisfaction program. Unfortunately, over half of the overheated Support Services organizations fail to implement this key employee satisfaction measurement program. Surveying support employees (in fact, all employees!) demonstrates to employees that the management team wants to hear how they are doing, and since actions always speak louder than words, employees are equally interested in seeing how management responds to their ESAT feedback. Another best practice that directly impacts many different business and employee metrics/results is Support team organization. Deploying a single tier (collaborative/swarming) support model can have a substantial impact on reducing employee attrition while improving employee satisfaction, contract renewal rates, and support gross margin. Two-thirds of overheated Support organizations have yet to adopt a single-tier support model and the result is a less efficient/effective Support organization that places a higher effort level on both the customer and the employee.
Figure 2: Support Services Benchmark Data on Support Tiers
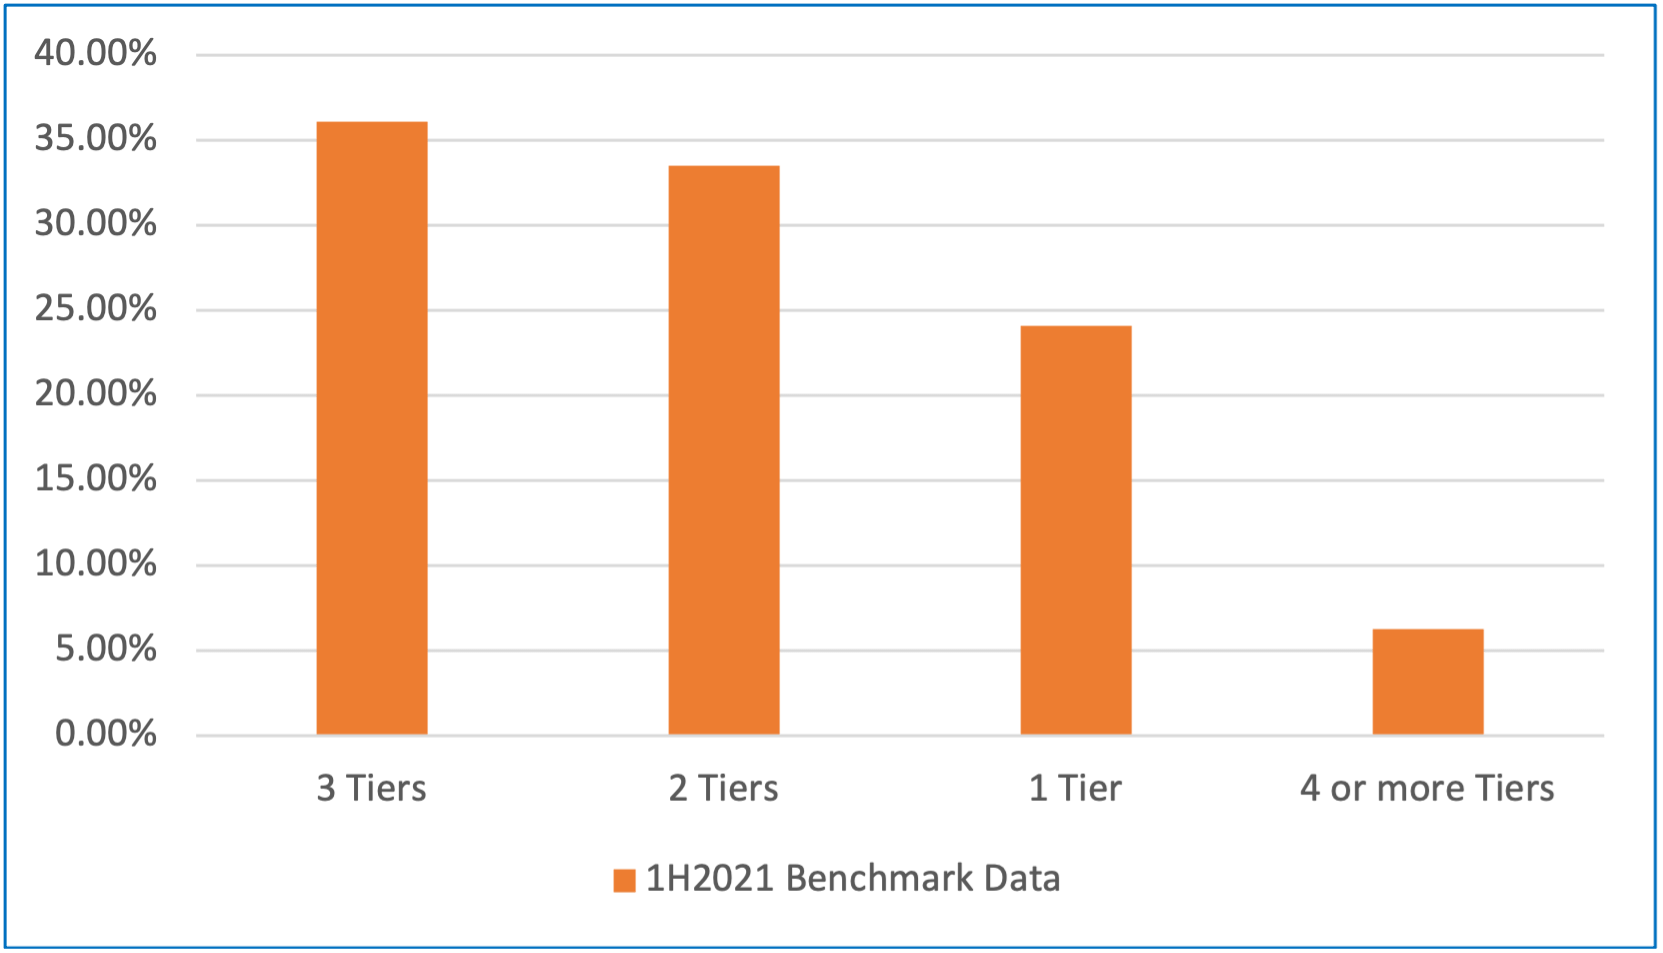
And speaking of customer effort, overheated Support organizations are conducting Customer Effort Score (CES) surveys 63% less often than industry. By not conducting this important survey best practice, overheated Support organizations are not capturing customer feedback on the areas in their support service delivery process where customers are expending the highest effort levels. And by not capturing CES survey data, overheated Support organizations continue to perpetuate high effort processes that not are not only impacting their customers, but are also causing their support employees to work harder than necessary to perpetuate inefficient support service processes. Going back to the metrics/results discussion, transforming from a multi-tier to a single-tier support model can help to remove a significant amount of friction from the customer and, just as importantly, from the support employee!The last significant practice that jumps out of the SS benchmark data is the disparity of overheated Support organizations that have not yet implemented a community forum – 41% less often compared to industry. The past two TSIA channel preference surveys have confirmed that customers not only have a strong preference for self-service (75%), but customers also have a continued preference (68%) for participating in a community to benefit from peer-to-peer activities (customers helping other customers) and direct support (company employees helping customers directly). Through 2020, we have seen a high adoption and a high continued planned spending for customer communities. Communities have become a standard part of corporate websites and remain a key element of customer self-service strategies that can help bolster assisted support deflection while providing a pleasing and low effort-level customer experience – a win-win for customer and company alike!
Key Takeaways and Next Steps
By analyzing the metrics/results and practices of our overheated support members in comparison to industry, we have found some surprising and some not too surprising results. From a metrics/results perspective, overheated Support organizations are frequently operating and performing at higher levels through heroics and sheer grit and determination. And we have heard from so many members who are presently in this maturity level quadrant, that they know they cannot sustain this same level of performance without burning their teams and themselves out. So, what needs to change? Members who are in the “Overheated SS” quadrant are there because their practice to metrics/results ratios are too low. And fortunately, members who are in this overheated quadrant have already taken the most important step towards cooling their Support organizations down – and that is they have recently conducted a Support Services benchmark and have received the necessary TSIA recommendations on which missing practices they should implement to cool down and ultimately create higher levels of operational efficient and effectiveness.So, for those members who have conducted a recent SS benchmark and have the necessary TSIA recommendations to progress out of the “Overheated SS” quadrant, my advice is for them to rely on TSIA’s research, advisories, and workshops to help accelerate their performance march over and into the “Optimized/Optimizing SS” quadrant. And lastly, for those members who suspect that they are living in an overheated environment, my advice is for them to work with their Member Success Manager to initiate the benchmark process before the summer heat becomes unbearable! Not a member of TSIA yet? No problem! Contact us today to learn more.